Shanghai Composite Index Chart
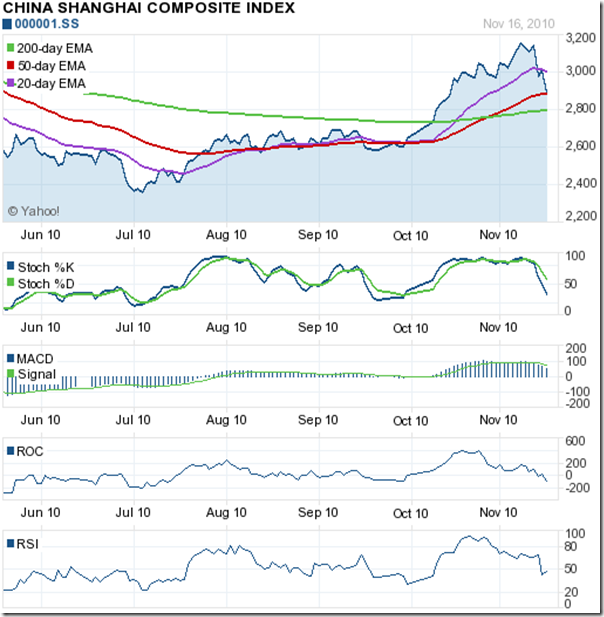
From the high of 3182 touched on Apr 15 ‘10, the Shanghai Composite index dropped more than 850 points to the low of 2320 on Jul 2 ‘10 before starting a rally. After spending almost 6 months below the 200 day EMA, the index broke above the long-term moving average on Oct 11 ‘10.
A sharp up move took the Shanghai Composite to a 7 month high of 3187 on Nov 11 ‘10. Just when it seemed that the bulls were back on top, fears of economic tightening brought the bears out of hiding. The index plummeted to the flattening 50 day EMA in three trading sessions, losing 9% (almost 300 points) from the recent high.
The technical indicators have turned bearish and the index may again fall below the 200 day EMA. The slow stochastic has dropped below the 50% level. So has the RSI. The ROC is in negative territory. The MACD is positive but below the signal line and falling.
If the 200 day EMA is unable to support the fall, there is good support in the 2650-2700 zone. Note that the RSI and ROC made much lower tops while the Shanghai Composite touched a new high. The negative divergences gave warning about an impending correction.
Taiwan (TSEC) Index Chart
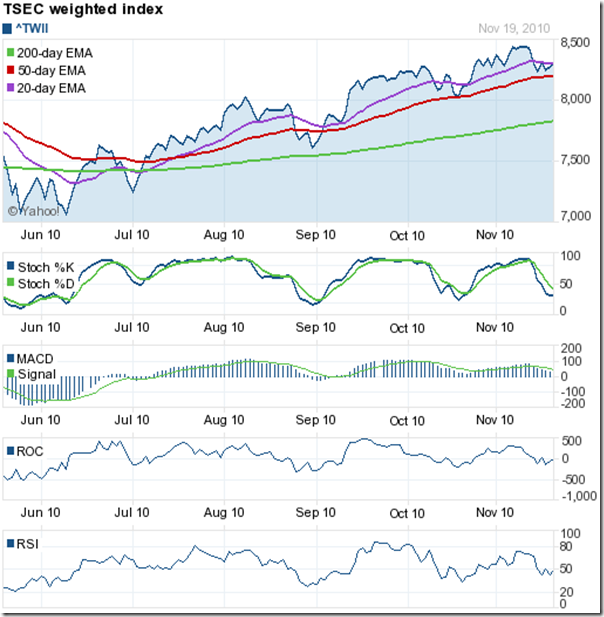
Unlike its mainland counterpart, the Taiwan (TSEC) index chart is in a firm bull market. After touching a new high of 8474 on Nov 8 ‘10 the index is facing a correction and the index has been consolidating between the 20 day and 50 day EMAs for the past 4 trading sessions.
The technical indicators are looking weak, but there are signs that the TSEC may soon move above the 20 day EMA and resume the rally. The slow stochastic has fallen below the 50% level but trying to turn around. The ROC has moved up to the ‘0’ line after slipping below it. The RSI is just below the 50% level.
The MACD, ROC and RSI made lower tops as the TSEC moved higher. The negative divergences usually indicate that a correction is around the corner.
Jakarta Composite Index Chart
The Jakarta Composite index has been moving up strongly on good volumes, and corrections have been minor and well-supported by the rising 20 day EMA. Negative divergences visible in the technical indicators did not result in a deeper correction.
The technical indicators are recovering quickly. The slow stochastic and RSI have bounced off their 50% levels. The ROC has moved up after touching the ‘0’ line. The MACD is just below the signal line in positive territory.
While the BRIC (Brazil, Russia, India, China) nations have received greater attention from global investors, the Jakarta Composite has been one of the best performers – touching new all-time highs on a regular basis.
Bottomline? The chart patterns of Asian indices are displaying contrasting fortunes. China’s fastest growing economy has not resulted in a strong bull market, as it trades way below its all-time highs. Taiwan (TSEC) is faring better, but is also trading below its all-time high. Jakarta Composite is looking overbought in the long-tem charts. Booking some profits in Jakarta and deploying in Taiwan may be a good idea. China should be avoided for the time being.


No comments:
Post a Comment