Last August, the stock chart pattern of Carborundum Universal was rising in an ascending triangle pattern, after hitting a double-top at 140 followed by a correction down to the 200 DMA at 101.
Ascending triangles are fairly reliable trend indicators, but I had sounded a note of warning because the RSI and slow stochastic were indicating negative divergences – making lower highs as the stock moved higher.
However, the volumes were gradually rising, supporting the up move. I had recommended that investors should wait for a break out above 140 before buying. Those who heeded my advice are sitting on 50% gains – outperforming the Sensex, which has gained 20% in the same period.
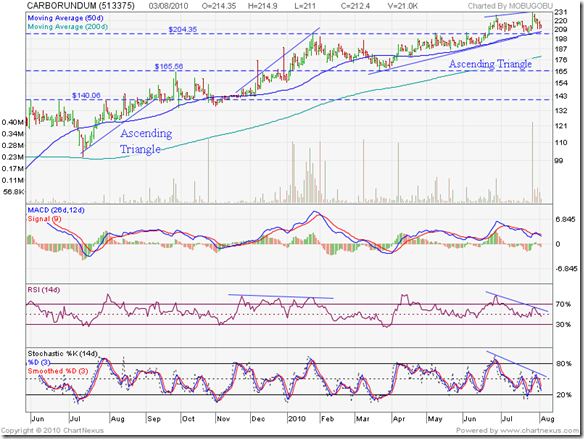
Let us take a look at the bar chart pattern of Carborundum Universal:
The ascending triangle pattern almost failed, but the stock price did break out above 140 on a volume spike in early Sep ‘09, just before reaching the apex of the triangle. Note how the 140 level, which had acted as a resistance, became a support level after the upward break out.
From Nov ‘09 to Jan ‘10, the stock embarked on a sharp rally to hit a high of 204. Volumes rose significantly, but have a look at the RSI. It made a series of flat and slightly lower tops, as the stock was making new highs.
The negative divergence led to a 5 months long sideways consolidation between 165 and 204. The bottom at 165 coincided with the previous top made in Sep ‘09. Bull market corrections tend to find support at previous tops.
The stock broke above the consolidation zone on good volumes in Jun ‘10, after forming another bullish ascending triangle formation. The resistance level of 204 has since turned into a support level. The 50 DMA is also providing good support to the up move.
The Carborundum Universal stock made a new 3 year high of 231 on a huge volume spike – which could be a sign of buying exhaustion. All three technical indicators – MACD, RSI, slow stochastic – made lower tops. The negative divergences warned of an ensuing correction. The stock is currently seeking support from the rising trend line, the 50 DMA and the 204 level.
If the stock breaks below the combined support, it can go down to the 200 DMA at 180, and further to the lower end of the consolidation zone at 165.
Bottomline? The stock chart pattern of Carborundum Universal is facing some headwinds after hitting a new high. The company is strong fundamentally and is growing steadily - generating good profits and cash flows. Existing investors can book part profits and redeploy at lower levels. New entrants can enter in the 165-180 zone.

No comments:
Post a Comment