Break outs in the Sensex, like beauty, often depends on the eyes of the beholder. A former beauty queen married to a very tall actor may be the epitome of beauty for many; to others, she may appear heavily made up and vapid.
On the short-term (3 months) bar chart pattern, the Sensex has given an exquisitely ‘beautiful’ upward break out on good volumes:
The upward sloping trading range (of about 400 points) of the past 6 weeks has clearly been overcome today, as the Sensex touched a new 52 week high of 18475 intra-day. The index closed above the trading range at 18454.
I had written the following concluding comments in last Saturday’s analysis of the Sensex chart:
‘The chart pattern of the BSE Sensex index is trying to break out upwards, but is being held in a tight leash by the bears – resembling a tug-of-war with one side slowly gaining ground but the other side refusing to give up without a good fight.’
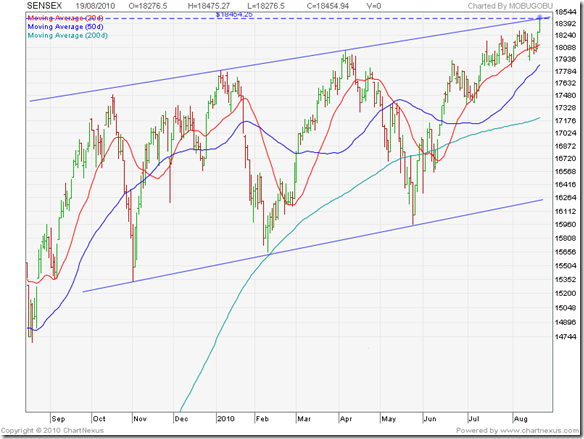
Have the bears lost the fight, or have they been saved by the ringing bell signalling the end of this round? For the answer, we need to take a look at the 1 year bar chart pattern of the Sensex:
What have we here? The Sensex is still in the ‘boring’ trading range of the past year! The intra-day high of 18475 (marked by the blue dot) did go past the trend line connecting the tops. But the index closed bang on the trend line. No break out yet.
Now look at what happened in Oct ‘09, Jan ‘10 and Apr ‘10. On all three occasions, the Sensex reversed directions after touching (or coming close to) the upper end of the trading channel and corrected all the way down to the lower end.
Will the bears use the opportunity to press sales? I would not bet against it. Friday’s (Aug 20, ‘10) trade promises to be very interesting. The Sensex can go either way from here.
Investors should refrain from buying, unless there is compelling value in individual stocks. There is no reason to sell off in a panic either. Hold on to your existing portfolios with tight stop-losses. Book part profits in stocks that have run-up sharply in the past few days.


1 comment:
hi Ghose,
Yes , the upmove is also reflected in the NIFTY - 3 MTH CHART.
SENSEX has hit the high point but not supported by MACD as it is lagging .The RSI is around 65 even though the SENSEX has hit high of 18475 . Since the RSI is still not in the overbought area perhaps there is steam left to go further.
Regards
dsouza
Post a Comment