FTSE 100 Index Chart
Only one conclusion can be drawn from the chart pattern of the FTSE 100 index: the penny has finally dropped - in technical parlance, the 50 day EMA has slipped below the 200 day EMA - and it is all over bar the shouting for the bulls.
All three EMAs are moving down with the index below them. The slow stochastic has entered the oversold zone. The MACD is below the signal line and falling in negative territory. The RSI is about to enter its oversold zone. The MFI is just below the 50% level.
But a couple of slivers of sunlight are peeking through the dark clouds. The index is nearly 300 points below the 20 day EMA, and may lead to a pull back. Both the MACD and MFI are showing positive divergence as they made higher bottoms while the FTSE 100 made a lower one.
Any pull back attempt by the bulls is likely to be used as selling opportunities by the bears.
DAX Index Chart
Last week, the falling DAX index chart pattern had received support at the 50 day EMA, and I had surmised as follows:
'The index found support from the 50 day EMA and it is possible that the bulls may use that to start another rally. The technical indicators are not supporting such a possibility.'
Note how the index bounced up from the 50 day EMA and even closed above the 20 day EMA. The bears attacked immediately and pushed the DAX all the way down to seek support from the 200 day EMA. The 20 day EMA is about to drop below the 50 day EMA.
The technical indicators are suggesting that the DAX will be formally entering a bear market in the near term. The slow stochastic has fallen to the edge of the oversold zone. The MACD is below the signal line and has turned negative. Both the RSI and MFI are below their 50% levels.
A bounce up from the 200 day EMA won't be surprising and can be used to sell.
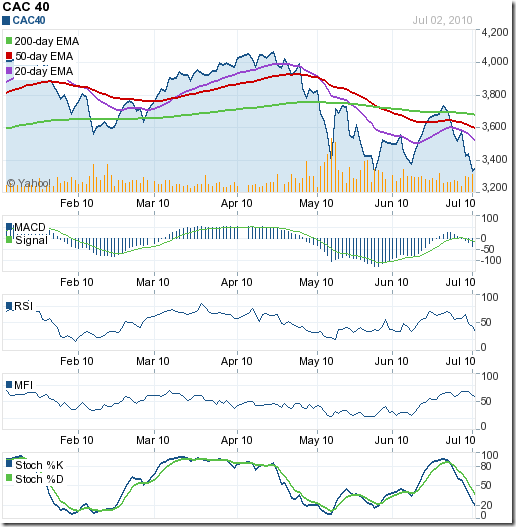
CAC 40 Index Chart
The CAC 40 index chart is sinking deeper into bear country, and has stopped just short of the May '10 low of 3288. That, and the positive divergences in the MACD and MFI are the last hopes for the bulls.
Any pull back is likely to be short-lived. The slow stochastic is at the edge of the oversold zone. The MACD is below the signal line and falling in negative territory. The RSI is below the 50% level. Only the MFI is above the 50% level, and holding out faint hope.
Bottomline? The chart patterns of the European indices are ringing 'game over' for the bulls. Sell on rises, or, follow the sentiment expressed in an old Jethro Tull song: 'I really don't mind if I sit this one out'.


No comments:
Post a Comment