FTSE 100 index chart
In last week's analysis of the FTSE 100 index chart pattern, I had mentioned that the bulls were not quite out of the woods. The index came under renewed bear attack right after crossing 5800 on Monday. On Wednesday, the FTSE fell below the 50 day EMA. On Friday, the index closed at 5553 - which was below the Jan '10 high of 5600, and a lower close on a weekly basis.
Previous tops are supposed to act as supports. Since Friday's close was within the 3% whipsaw lee way used in technical analysis, we will consider that the Jan '10 top has supported Friday's close - giving the bulls some hope of renewing the battle for supremacy next week.
But the bull juggernaut is now running on an empty tank. The 200 day EMA is still rising, which means the long term bull market is not under threat yet. But the 50 day EMA has gone flat and the 20 day EMA is sliding down. Wednesday's down day saw the highest volumes in more than a month - a sign of distribution.
The technical indicators are all bearish. The slow stochastic has dropped to the edge of the oversold zone. The MACD is well below the signal line and barely positive. The RSI and MFI are both below their 50% levels, and heading down.
The FTSE 100 is poised at a critical support. Any upward bounce to the 20 day EMA can be used to sell. A further fall next week can take the index down towards the 200 day EMA.
DAX index chart
The German DAX index fared a little better than the FTSE 100 chart in its effort to fight off the bears. Friday's close of 6136 was lower on a weekly basis but higher than the Jan '10 top of 6094. The index was well supported by the 50 day EMA, but remained below the 20 day EMA.
Volumes on Wednesday's down day was the highest during the week. Note that the recent large volumes spikes on Apr 16 '10 and Mar 19 '10 were on down days as well - signs of smart money bailing out.
The technical indicators are reflecting bearishness in the index. The slow stochastic, RSI and MFI are all moving down below their 50% levels. The MACD is positive but below the signal line. The bulls are definitely on the ropes, but still on their feet.
CAC 40 index chart
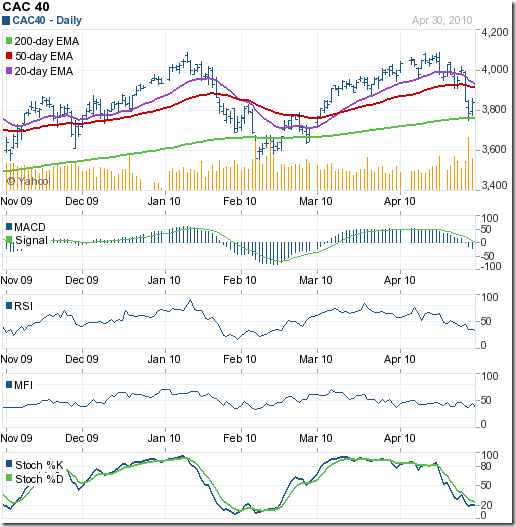
The CAC 40 index chart pattern shows that the bulls have taken some hard knocks and may go down for the count soon. Support from the 200 day EMA saved them at the nick of time. But for how long?
The index has made a double-top as well as a rounding top pattern. Both are bearish. Any breach of the Feb '10 low of 3545 will confirm the double top. The 50 day EMA has started falling. The 20 day EMA is about to cross below it.
The MACD has dipped into the negative zone. The slow stochastic is at the edge of the oversold region. Both the RSI and MFI are below their 50% levels, and falling.
The bull rally in the French index is under real threat of being stalled.
Bottomline? The European indices have been badly shaken by the poor economic situations in Greece, Spain, Portugal, Italy. That things will get worse before they get better is dawning on market players. 'Sell in May and go away'? At least refrain from buying.


No comments:
Post a Comment