FTSE 100 index chart
The FTSE 100 index chart pattern had a bit of a struggle trying to fend off the bears - who used the twin excuses of the Goldman Sachs fraud news and the Greek sovereign default issues to mount a strong attack.
After managing to stay above the 20 day EMA during the first three days of the week, the FTSE 100 dropped below the flattened short-term average on Thursday. By Friday, the bulls mustered some courage and a bout of buying aided by short covering took the index back up to the 20 day EMA (Friday's trading not reflected in the chart).
The FTSE 100 closed 21 points lower on a weekly basis. That's not all. Volumes on Wednesday and Thursday - the two down days - were the highest during the week. Not a propitious sign for bulls.
The slow stochastic, RSI and MFI have all dropped to (or below) the 50% levels. The MACD is positive but falling and is below the signal line. The widening distance between the 50 day and 200 day EMAs is another cause of concern.
The bulls are not out of the woods yet. This week's round goes to the bears on points.
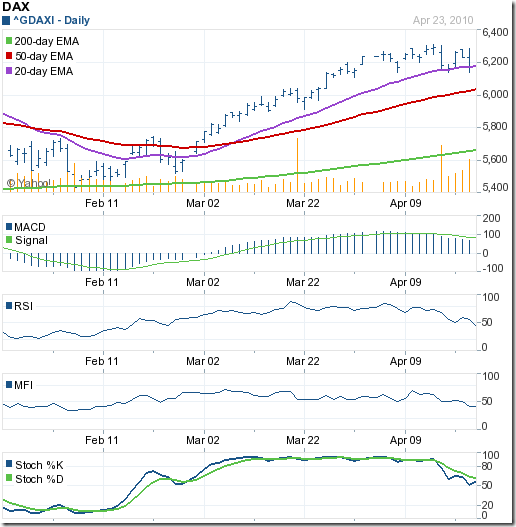
DAX index chart
The DAX index chart pattern had less problems dealing with the bears. In spite of a big increase in volumes during Thursday's down day, the index managed to close exactly on the 20 day EMA after dropping below it intra-day.
A spirited fight back by the bulls not only took the index above the 20 day EMA but also above the psychological 6200 level. The index closed more than 1% higher on a weekly basis.
The widening distance between the EMAs is signalling that the bears may be regrouping. The MFI and RSI have both slipped below the 50% level. The slow stochastic managed to bounce up from its 50% mark. The MACD is positive but a bit below the signal line. The bulls have the edge in the German index.
CAC 40 index chart
The CAC 40 index chart pattern is having trouble shaking off the bears. Except on Tuesday, it closed below the 20 day EMA. Thursday's high volume down day saw the CAC 40 dip below the 50 day EMA on intra-day basis before managing to close on the medium-term moving average. Friday's small up move could not prevent a lower weekly close below a drooping 20 day EMA.
The MACD is barely positive and is below the signal line. Both the RSI and MFI are below their 50% levels. The MFI has remained below the 50% level for a month. The slow stochastic has almost fallen to the oversold zone. The bears have won the week's round on points - giving them a 2-1 lead heading into the final week of April '10. Will investors sell and go away in May?
Bottomline? The chart patterns of the European indices faced a strong bear attack last week, but haven't suffered too badly. High volume down days are a sign of distribution, so investors should remain cautious. Buying should be very stock specific and in small quantities with strict stop losses. Continue to weed out non-performers in the portfolio.


No comments:
Post a Comment