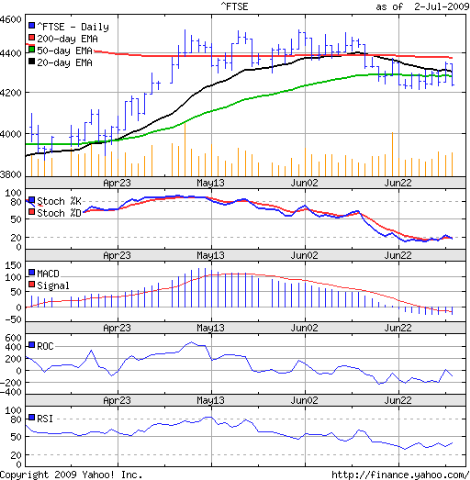
It has been a month since I last looked at the FTSE 100 index chart pattern. The index was flirting around with its 200 day EMA while the 4500 level was playing the role of the stern aunt - trying to keep the index at arm's length.
The FTSE actually managed 6 consecutive closes above the 200 day EMA after my previous article, and that pulled the 20 day EMA marginally above the long-term moving average.
The 3 months bar chart pattern of the FTSE 100 index shows that all hopes of a new bull market were belied:-
The negative divergences in all the technical indicators - which made lower tops while the FTSE was consolidating sideways - finally broke the efforts by the index to keep its nose above the 200 day EMA.
The slow stochastic has slid into the oversold zone and is struggling to get out. The MACD has not only entered the negative zone but is also below its signal line. The ROC has been in the negative zone for a while, and a couple of efforts to get into the plus side has failed. The RSI is moving sideways, just above the oversold zone.
The volumes haven't gone down much. But all the three EMAs have started to move downwards. Once the 20 day EMA moves below the 50 day EMA, the index will be conclusively back in the bear market. Desperate efforts by the bulls to keep the index supported at the 4200 level seems doomed to failure.
Bottomline? The FTSE 100 index chart pattern doesn't hold out much hope for a recovery any time soon. Investors can start pulling out gradually and re-invest in fixed income and gold ETFs.

No comments:
Post a Comment